
For decades, engineers have relied on a formula dating from 1940 to estimate peak water demand, a key factor in specifying the smallest pipe size that will provide sufficient water pressure for every fixture in a building to function normally. Sloan’s chief scientist, Kay Herbert, Ph.D., has developed a new formula that yields more accurate water demand estimates— which can save costs, reduce water use, and prevent bacteria growth. (Sloan is a benefactor of MCAA22.) The new formula is ideal for modern engineers grappling with green technology, touch-free fixtures, and hygiene concerns in the post-COVID-19 era.
Why Estimating Water Demand is So Important—and So Difficult
Pipes that are too large increase cost unnecessarily and can collect excess water that may breed pathogens. Pipes that are too small do not allow enough water volume for fixtures to operate properly under peak demand. Engineers are charged with specifying the right sized pipes—not just for the main building intake, but for every pipe in the building. That specification depends on an accurate estimate of peak water demand—the maximum average load on the system in one hour.
If a building only had one fixture, estimating peak water demand would be easy. But estimation is complicated:
- Even small buildings have several faucets and flushometers, and large buildings can have thousands of them.
- Faucets and flushometers do not run continuously—only when people use them.
- The number of people in the building may vary widely from one time of day to another or from one day to the next.
- Fixtures in different parts of the building may be set with different flow rates.
- Multistory buildings must employ mechanical pumps to overcome the loss of water pressure as water rises in vertical pipes.
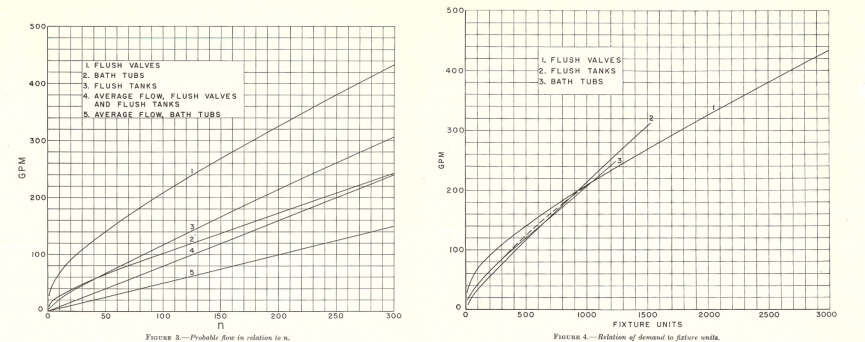
Roy Hunter’s ground-breaking paper in 1940 took these variables into account and became the standard for estimating plumbing system loads for generations of engineers. While Hunter’s system has greatly contributed to plumbing applications, it leaves some gaps for modern plumbing systems.
Many engineers use the International Association of Plumbing and Mechanical Officials (IAPMO) calculator, based on Hunter’s curve, which does not account for different water pressures or fixture flow rates.
Hunter’s Curve Explained—Without Calculus
Hunter’s curve assumes that every plumbing fixture has an expected on-time, during which it draws water at a specific flow rate for a specific duration of time. Every fixture also has a minimum expected time between uses, impacted by the number of people in the building, their behavior, and the properties of the fixtures. Estimating peak demand takes into account the following variables:
- Fixtures
- Flow rate
- Duration
- Time between uses
- Number of people in the building
- Fixture characteristics

efficient use of water.
Because several of these variables change drastically over time, estimating peak demand becomes a probability problem. Hunter proposed using the 99th percentile of each fixture’s likelihood of being in use—in other words, the most fixtures running at the same time—to create his probability curve.
However, Hunter had to assign arbitrary values to each fixture to account for multiple fixture types with different flow rates. That’s why Hunter’s method can be off by more than 20 percent in estimating peak demand with modern fixtures.
How Convolution Conquers Complexity
When you account for all the probabilities for each variable, the complexity of accurately estimating peak water demand is truly staggering. For instance, as water is pumped higher in a tall building, water pressure varies from one floor to the next. A flush valve set to a given flush volume will open for a shorter duration at higher pressure, translating to a lower probability that the valve is open, which impacts the demand calculation. You can have a different calculation for every floor in the building.
According to Herbert, exact enumeration of all the variables in play requires 2n calculations—with n being the total number of fixtures in the building. A building with 1,000 fixtures would require 21,000 calculations, which would require NASA-level computational power. Other methods are more accurate for large buildings but less accurate for smaller buildings.
Herbert’s formula is the most accurate yet. It involves convolution—a mathematical operation on two functions that expresses how the shape of one is modified by the other. For non-mathematicians, Herbert describes convolution as “a fancy type of multiplication.”
With convolution, the number of calculations required to account for all the probabilities in a peak demand estimate is only n2, where n is the total number of fixtures in the building. In a building with 1,000 fixtures, that’s 10002, or one million calculations, which is a much lighter computational load.
How much lighter? Dr. Herbert runs it on a laptop.
Three Reasons to Use Herbert’s Formula
More accurate peak water demand estimates are important for three reasons.
- Cost. Most engineers specify larger pipes than needed, knowing their estimates can be off by as much as 20 percent, said Herbert. They reason that it is better to spend too much than to risk the pipes failing to deliver enough water during peak demand.
- Hygiene. Too-large pipes are more likely to retain standing water, which can breed Legionella bacteria (that cause Legionnaire’s disease) and other pathogens.
- Sustainability. Modern faucets and flushometers deliver optimal water-saving performance when they are adjusted to the right flow rate. To estimate peak water demand more accurately, engineers need more accurate flow rates—so they are more likely to inform installers of the correct flow rates to set.
Finally, estimating accurate peak water demand is just good engineering. With Herbert’s formula, there is no excuse for anything less.
For more information, visit www.sloan.com. MCAA thanks Sloan for being a benefactor of MCAA22.